Working with the Aerospike Monitoring Stack dashboards
Using locations, types, and labels
Metrics data from Aerospike is described by the location API that generated the metric. Metrics are further described by type for the scope, data type, and duration of the data. Each metric also may have labels that allow for sorting and filtering.
For a complete list of metrics available, see the Metrics Reference.
Location
Each metric is described for a location that refers to the API that generated the metric and corresponds to the asadm show command parameter. The Aerospike Prometheus Exporter prepends the metric with a string to identify the location. For example, the metric conns_in_use, generated for the Users location, becomes aerospike_users_conns_in_use when exported from a node. Following are the locations mapped to the string prefixes prepended by the Exporter. Use a metric with its exported prefix when creating alerts or displaying the metric in a dashboard.
| Location | Exported prefix |
|---|---|
| Bins | aerospike_namespace_ |
| Namespace | aerospike_namespace_ |
| Sets | aerospike_sets_ |
| Sindex | aerospike_sets_ |
| Statistics | aerospike_node_stats_ |
| Users | aerospike_users_ |
| XDR | aerospike_xdr_ |
| XDR - DC | aerospike_xdr_ |
Type
The Metrics Reference also describes the types that apply to a specific metric. These are shown with colored highlighting in the upper right corner of the metric's reference entry. Types describe the Aerospike server edition, the data duration, and the data type for the metric.
Edition
When the enterprise edition label is shown, the metric is available only in Aerospike Enterprise Edition. Otherwise, the metric is available for all Aerospike editions.
Duration
instantaneous - the data is measured at a specific instant. For example, the
memory_used_bytesmetric is an instantaneous measure of the total bytes of memory used.cumulative - the data is accumulated from the last restart. For example, the
batch_sub_delete_errormetric reports the accumulated subtransactions that failed with an error since the last restart.moving average - the data reported is a moving average of all values since the last restart. For example, the
device_compression_ratiomeasures the average compressed size to uncompressed size ratio since the last restart.
Data type
integer
decimal
boolean
Labels
Metrics may also be described with labels in queries on the command line or in a dashboard. You can sort and filter metric data based on these labels. Following are some of the more prominent labels used in Aerospike:
ns- corresponds to the specific namespace of the metric.set- a group of records within a collection.job_name- a label you can set on the Aerospike Prometheus Exporter.aerospikeis the default. The label is customizable.cluster_name- corresponds to the name set for in your cluster configuration. It is required for monitoring multiple clusters.service- IP:port of the nodes.instance- IP:port of the Exporter on the node.
Example PromQL query used in the dashboard
An example query to compute and view transactions per second (TPS) for Aerospike read operations is detailed here.
The query passes the following parameters to the rate() function:
- The metric name
aerospike_namespace_client_read_success. - The
joblabel asaerospike. - The
cluster_namelabel asaerospike-release-aerospike-enterprise.
rate(aerospike_namespace_client_read_success{job="aerospike", cluster_name="aerospike-release-aerospike-enterprise"}[1m])+
rate(aerospike_namespace_client_read_not_found{job="aerospike", cluster_name="aerospike-release-aerospike-enterprise"}[1m])
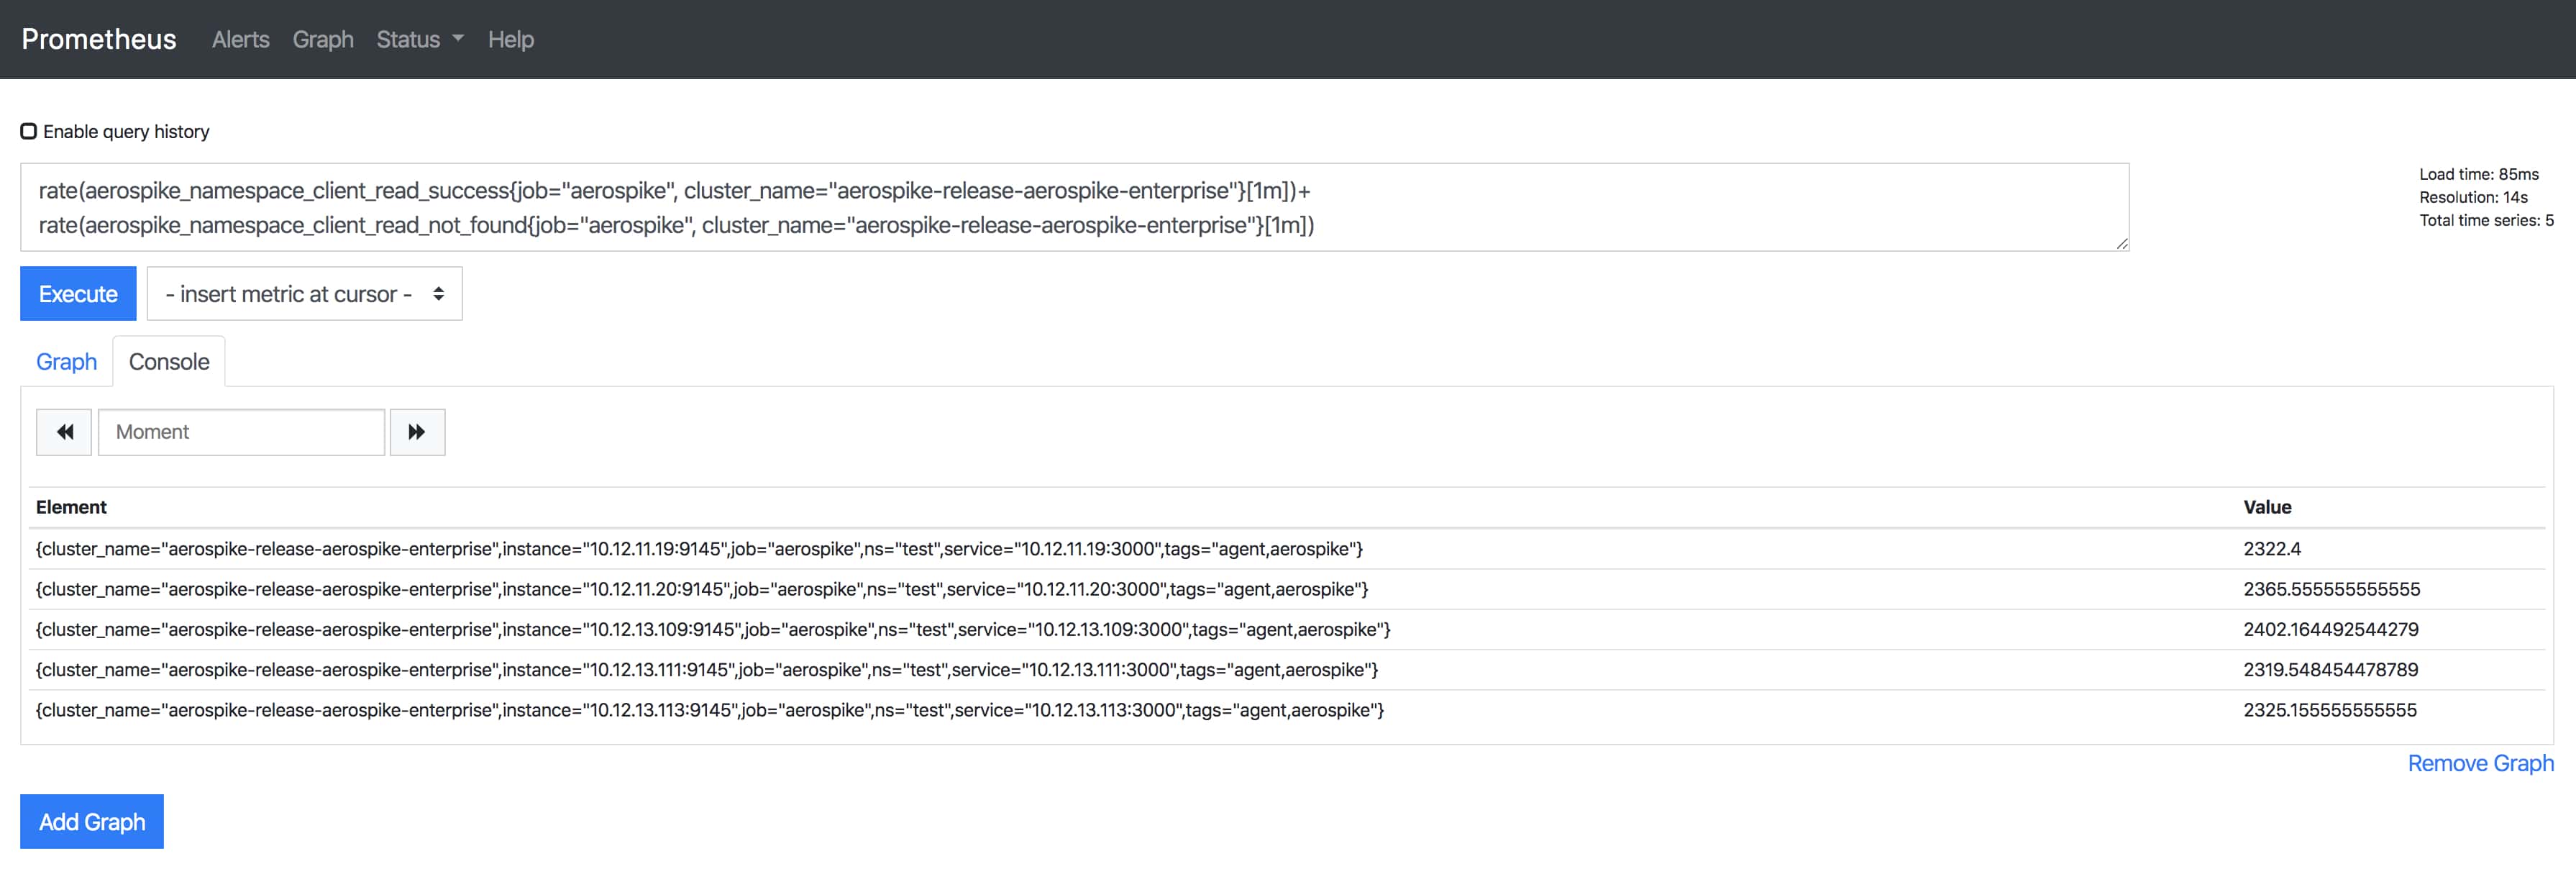
Query results
The query returns the per-second average rate of increase in TPS for Aerospike reads.
The following results are displayed in the dashboard.
Dashboard example console
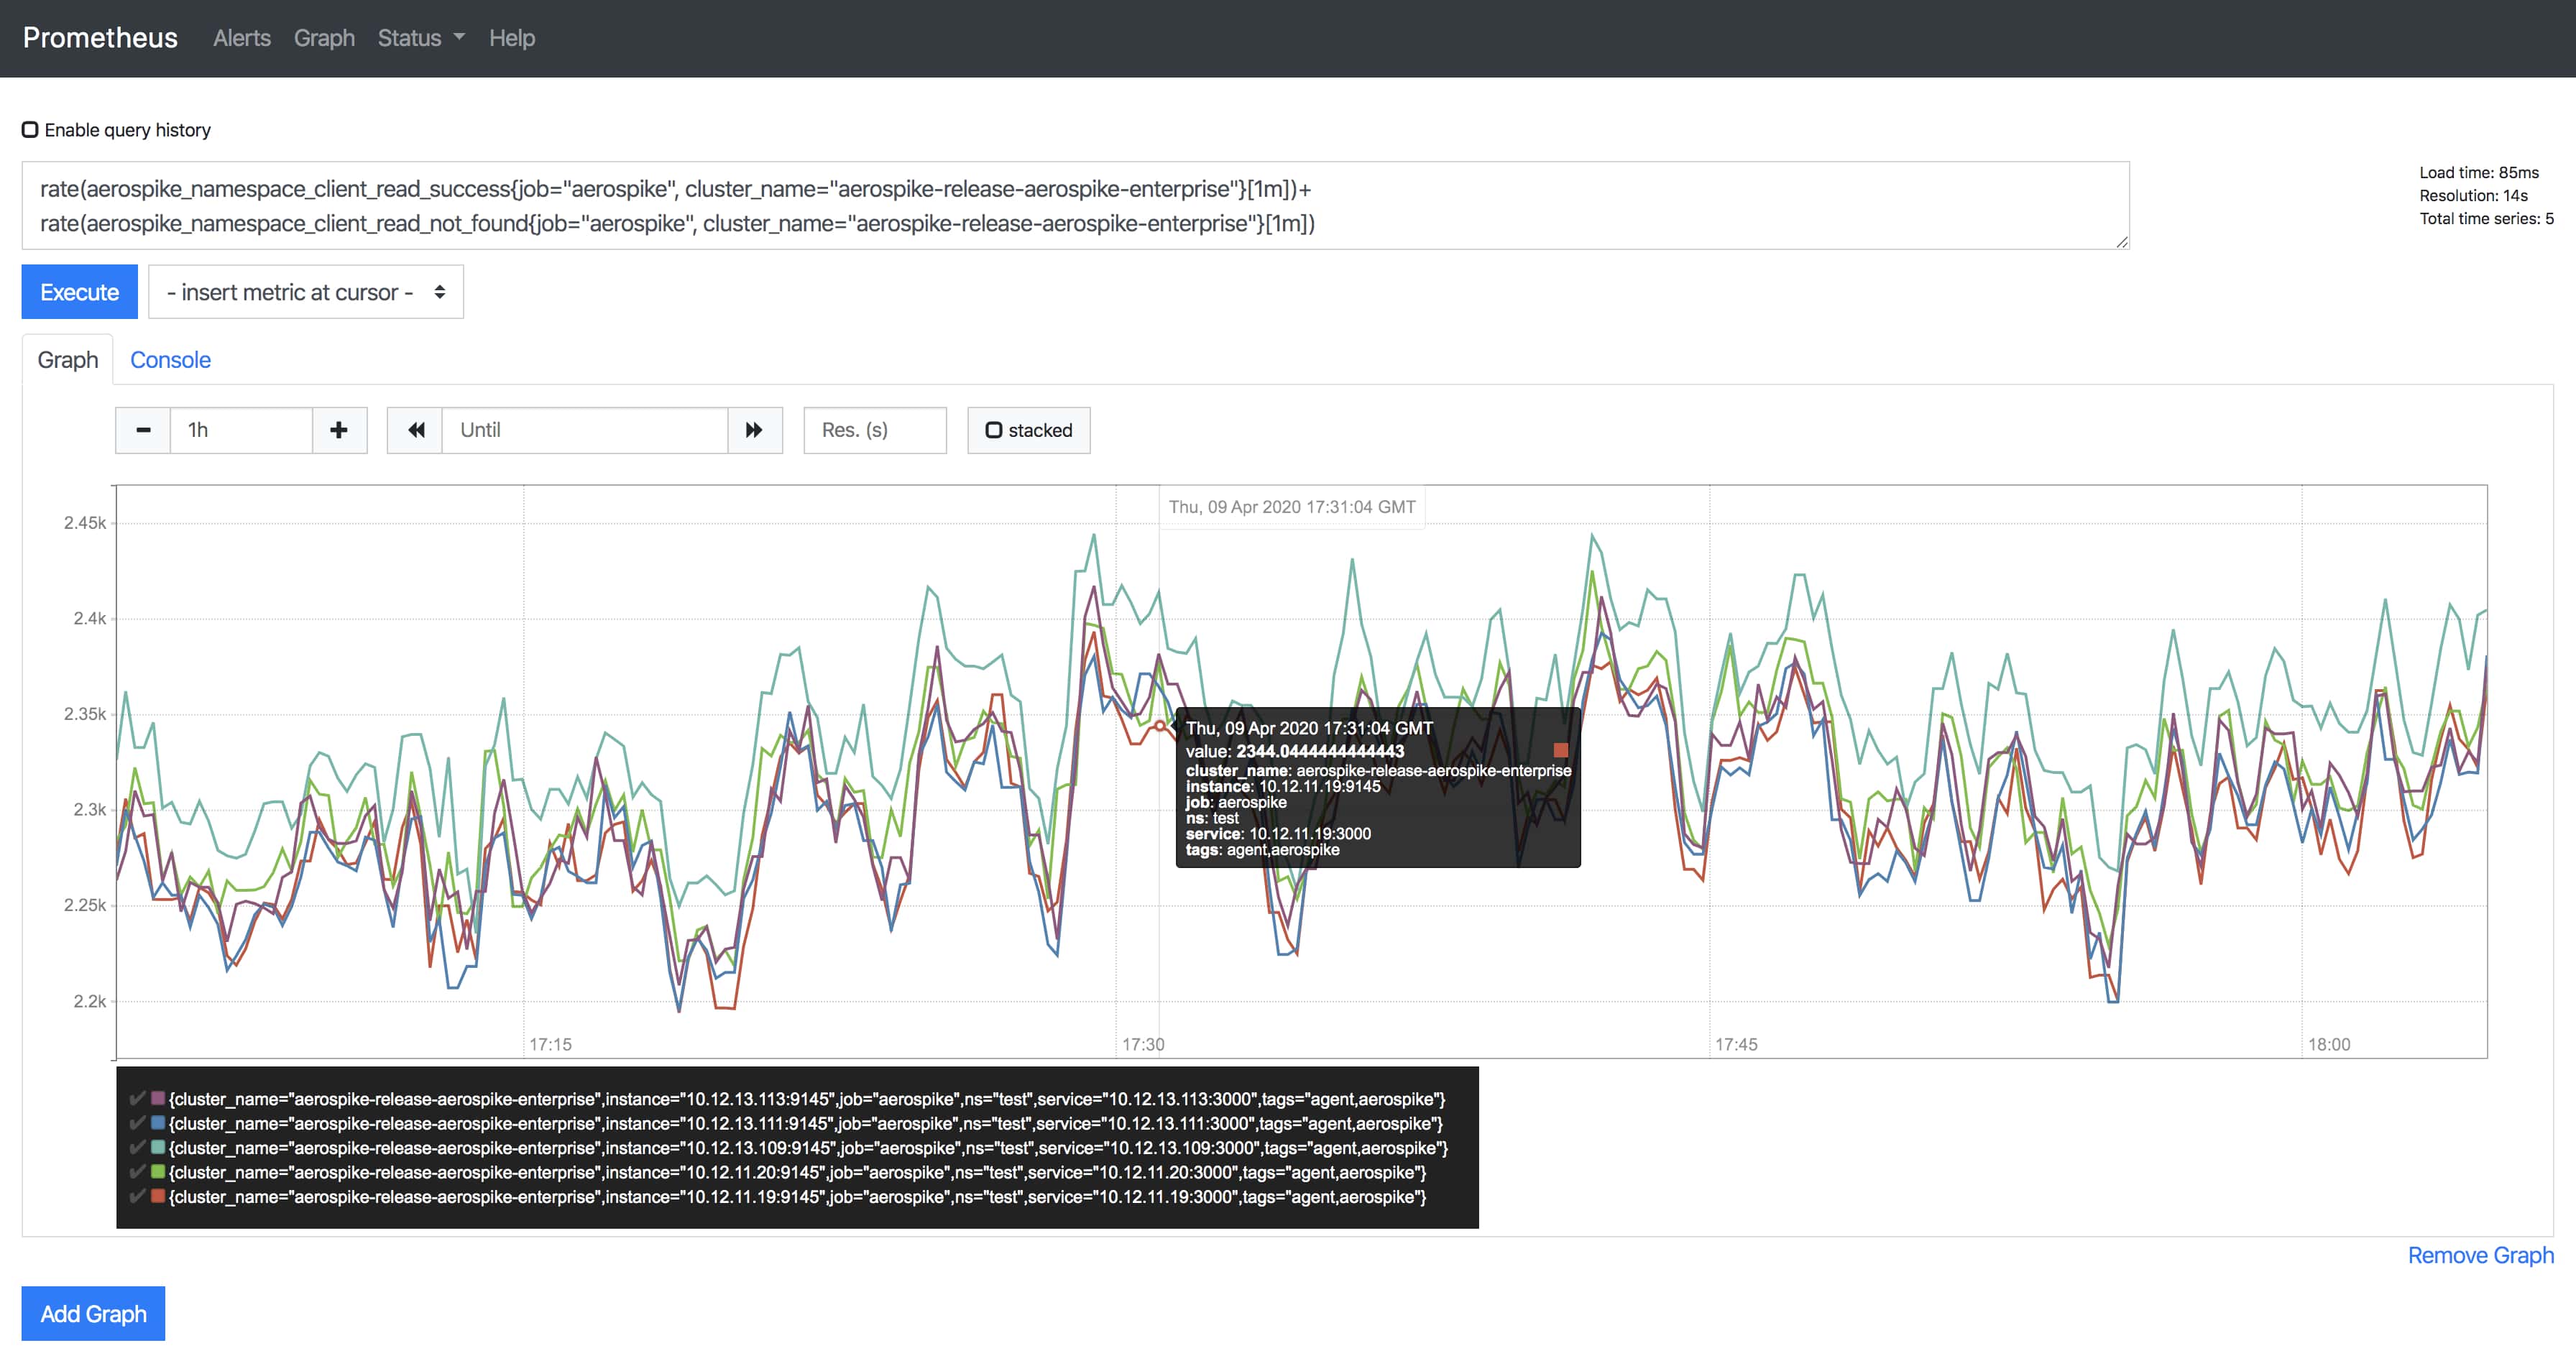
Example graph
Dashboard example graph
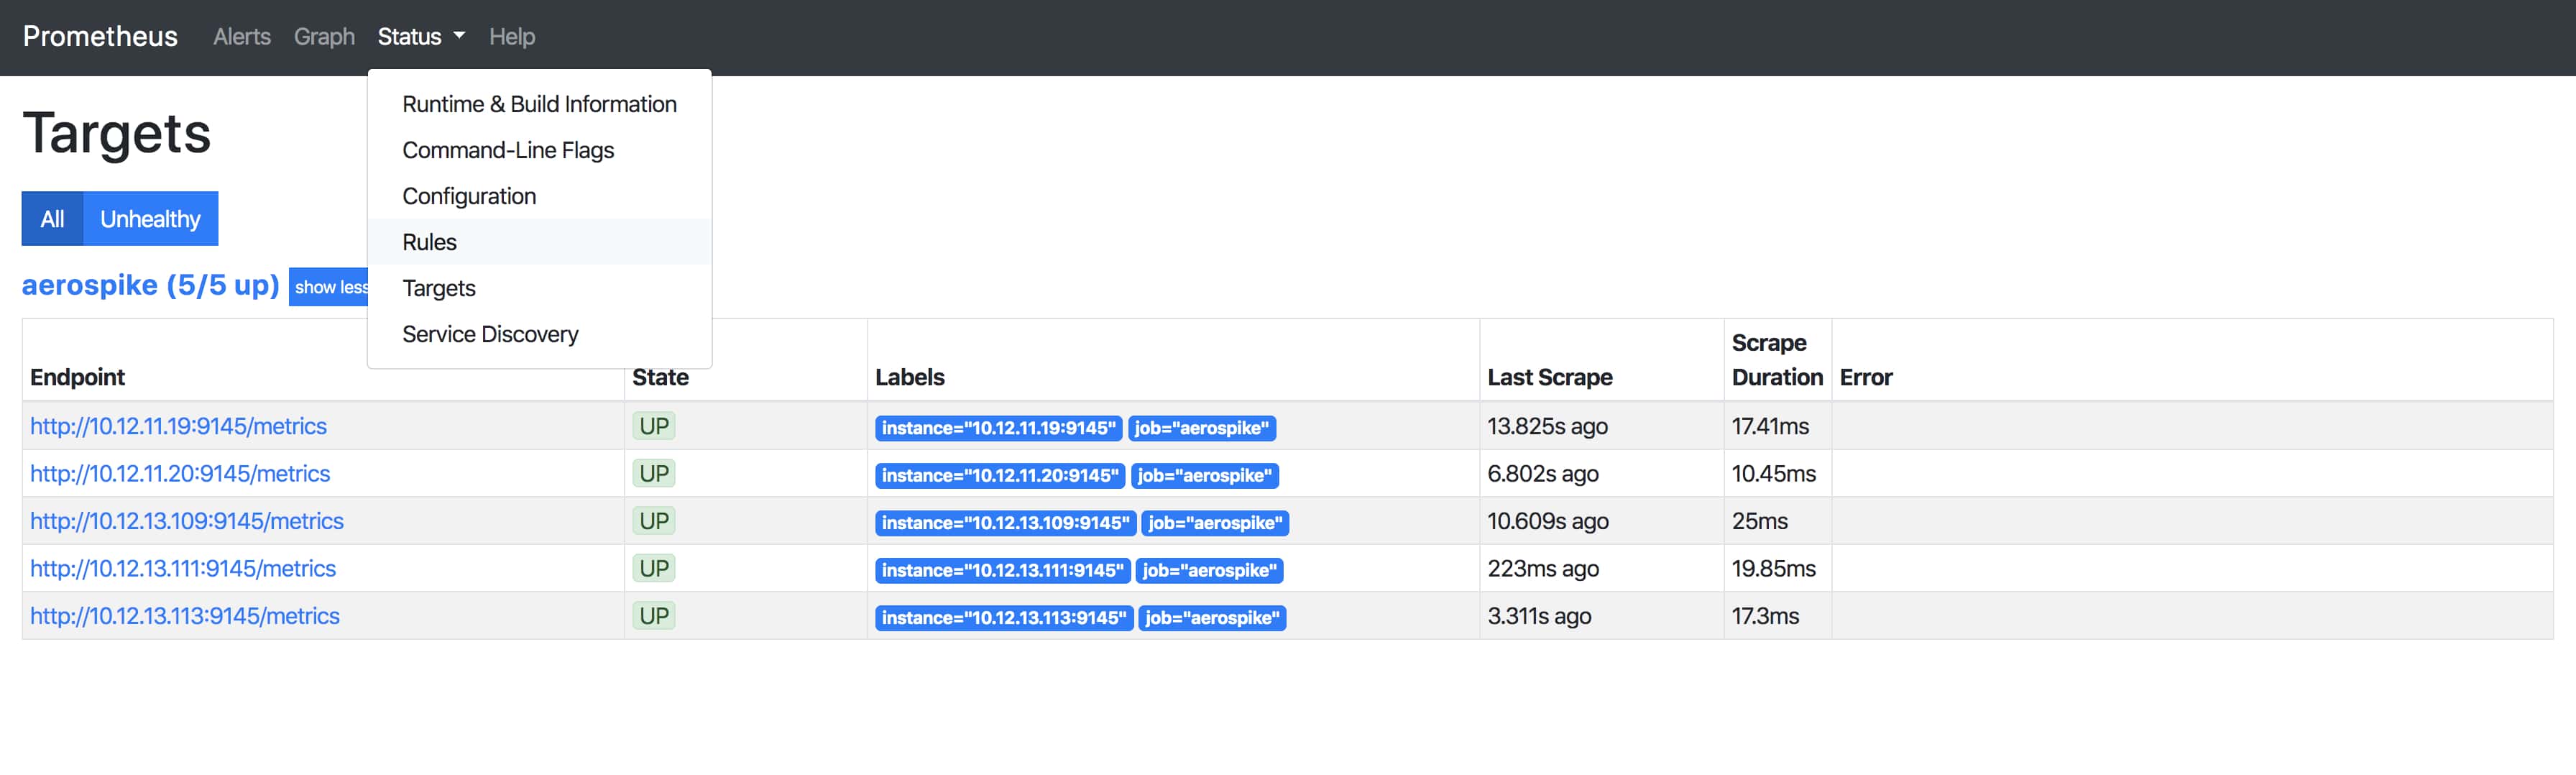
Other operations on the dashboard
In addition to queries, you can also check the status of scrape targets, alert rules, configuration, and more.
Dashboard status menu