Prometheus Integration
Prometheus integration is enabled by default for all HTTP outbound connectors, and is enabled for outbound connectors compatible with Aerospike 5.0 and later, and JMS Inbound 2.0 and later, when the manage subsection in the service section is configured in the connector's configuration file. The REST endpoint to integrate with Prometheus is manage/rest/v1/prometheus.
For an HTTP outbound connector, the service port and manage port are the same.
Prometheus Configuration for an Aerospike Connector
The scrape_configs section of Prometheus configuration has to point to the Aerospike Connector's manage REST API endpoint.
...
scrape_configs:
  - job_name: aerospike-connect
    metrics_path: /manage/rest/v1/prometheus
    static_configs:
      targets: # List of Manage Endpoints of all Aerospike Connectors exposing Prometheus metrics.
        - outbound-connector-1:8081
        - outbound-connector-2:8081
        - jms-inbound-1:8081
        - jms-inbound-2:8081
...
Aerospike Connector's Metrics available in Prometheus
The metrics are exported with the connector name prefixed to the metric name.
For example, the connections metric of an outbound connector is exported as aerospike_jms_outbound_connections,
aerospike_kafka_outbound_connections, aerospike_pulsar_outbound_connections, aerospike_xdr_proxy_connections in JMS, Kafka,
Pulsar, XDR Proxy outbound connectors respectively and aerospike_jms_inbound_jms_connections in JMS Inbound
connector.
In the following tables {connector_name} is used as a placeholder for the connector name.
Replace it with one of the applicable connector names
aerospike_jms_outbound, aerospike_kafka_outbound, aerospike_pulsar_outbound,
aerospike_xdr_proxy or aerospike_jms_inbound in your use-case.
Connector exposes several metrics. We have only highlighted some of the important ones here.
Counters
A counter is a cumulative metric that represents a single monotonically increasing counter whose value can only increase or be reset to zero on restart.
Counters for the outbound connector
| Name | Label | Description | Note |
|---|---|---|---|
| {connector_name}_connections | {status=active} | Count of active XDR connections to the outbound connector. | |
| {connector_name}_connections | {status=closed} | Count of closed XDR connections to the outbound connector. | |
| {connector_name}_requests | {status=error} | Count of requests that could not be written to the external system being used, such as Kafka, JMS, Pulsar, etc. | |
| {connector_name}_requests | {status=parse-error} | Count of XDR records which could not be parsed. | |
| {connector_name}_requests | {status=skipped} | Count of XDR records which were skipped and not written to the external system. | |
| {connector_name}_requests | {status=success} | Count of records written to the external system. | |
| {connector_name}_jms_connections | {status=active} | Count of active JMS connections. | Only for Aerospike JMS Outbound. |
| {connector_name}_jms_connections | {status=closed} | Count of closed JMS connections. | Only for Aerospike JMS Outbound. |
| {connector_name}_kafka_producers | {status=active} | Count of active Kafka producers. | Only for Aerospike Kafka Outbound. |
| {connector_name}_kafka_producers | {status=closed} | Count of closed Kafka producers. | Only for Aerospike Kafka Outbound. |
| {connector_name}_pulsar_producers | {status=active} | Count of active Pulsar producers. | Only for Aerospike Pulsar Outbound. |
| {connector_name}_pulsar_producers | {status=closed} | Count of closed Pulsar producers. | Only for Aerospike Pulsar Outbound. |
Counters for the inbound connector
| Name | Labels | Description | Note |
|---|---|---|---|
| {connector_name}_jms_connections | {status=active} | Count of an active connections to the JMS broker. | Only for JMS Inbound 2.0+ |
| {connector_name}_jms_connections | {status=closed} | Count of a closed connections to the JMS broker. | Only for JMS Inbound 2.0+ |
| {connector_name}_consumer | {status=active}, {source=<jms-destination-type>:<jms-destination-name>} | Count of an active consumers for the given JMS destination. | Only for JMS Inbound 2.0+ |
| {connector_name}_message | {status=success}, {source=<jms-destination-type>:<jms-destination-name>} | Count of successfully processed incoming JMS message. | Only for JMS Inbound 2.0+ |
| {connector_name}_message | {status=error}, {cause=aerospike-error}, {source=<jms-destination-type>:<jms-destination-name>} | Count of message handling errors which are neither parsing nor conversion errors. | Only for JMS Inbound 2.0+ |
| {connector_name}_message | {status=error}, {cause=conversion-error}, {source=<jms-destination-type>:<jms-destination-name>} | Count of errors which occurred while converting JMS message to an Aerospike message. | Only for JMS Inbound 2.0+ |
| {connector_name}_message | {status=error}, {cause=parse-error}, {source=<jms-destination-type>:<jms-destination-name>} | Count of errors which occurred while parsing an incoming JMS message. | Only for JMS Inbound 2.0+ |
where
- the
jms-destination-typeis one of the valid JMS destinations:queueortopic - the
jms-destination-nameis a name given to that destination. For e.g. aerospike_jms_inbound_consumer{status="active",source="queue:apple_queue"}.
Gauge
A gauge always returns the current value of the metric and can increase or decrease.
| Name | Label | Description | Note |
|---|---|---|---|
| {connector_name}_records_inprocess | Number of records currently being processed by the outbound connector. | ||
| {connector_name}_requests_lag | The lag between update of a record in Aerospike and it reaching the Connector measured in milliseconds. Calculated as aerospike_record.lut - current_time. Its sampled every second based on the XDR record being processed at that time, it is approximate and not exact. | ||
| {connector_name}_jvm_attribute_uptime | The uptime of the Java virtual machine in milliseconds. | Only available in Aerospike JMS Inbound 2.0+ and Aerospike ESP Outbound 2.0+. | |
| {connector_name}_jvm_buffers_direct_capacity | The maximum amount of a direct buffer which can be used by the connector in bytes. | Only available in Aerospike JMS Inbound 2.0+ and Aerospike ESP Outbound 2.0+. | |
| {connector_name}_jvm_buffers_direct_count | The number of direct buffers currently allocated by the connector. | Only available in Aerospike JMS Inbound 2.0+ and Aerospike ESP Outbound 2.0+. | |
| {connector_name}_jvm_buffers_direct_used | The size of a direct buffer used by the connector in bytes. | Only available in Aerospike JMS Inbound 2.0+ and Aerospike ESP Outbound 2.0+. | |
| {connector_name}_jvm_files_max | The maximum number of file descriptors. | Only available in Aerospike JMS Inbound 2.0+ and Aerospike ESP Outbound 2.0+. | |
| {connector_name}_jvm_files_open | The number of open file descriptors. | Only available in Aerospike JMS Inbound 2.0+ and Aerospike ESP Outbound 2.0+. | |
| {connector_name}_jvm_gc_count | {gc=<gc-name>-Old-Generation} | The total number of collections that have occurred for the Old Generation. The name of a GC (G1 in the example) may differ. | Only available in Aerospike JMS Inbound 2.0+ and Aerospike ESP Outbound 2.0+. |
| {connector_name}_jvm_gc_count | {gc=<gc-name>-Young-Generation} | The total number of collections that have occurred for the Young Generation. The name of a GC (G1 in the example) may differ. | Only available in Aerospike JMS Inbound 2.0+ and Aerospike ESP Outbound 2.0+. |
| {connector_name}_jvm_gc_time | {gc=<gc-name>-Old-Generation} | The approximate accumulated collection elapsed time in milliseconds for the Old Generation GC. | Only available in Aerospike JMS Inbound 2.0+ and Aerospike ESP Outbound 2.0+. |
| {connector_name}_jvm_gc_time | {gc=<gc-name>-Young-Generation} | The approximate accumulated collection elapsed time in milliseconds for the Young Generation GC. | Only available in Aerospike JMS Inbound 2.0+ and Aerospike ESP Outbound 2.0+. |
| {connector_name}_jvm_memory_heap_max | The maximum amount of heap memory in bytes that can be used by the Java Virtual Machine. | Only available in Aerospike JMS Inbound 2.0+ and Aerospike ESP Outbound 2.0+. | |
| {connector_name}_jvm_memory_heap_used | The amount of used heap memory in bytes. | Only available in Aerospike JMS Inbound 2.0+ and Aerospike ESP Outbound 2.0+. | |
| {connector_name}_jvm_memory_non_heap_used | The amount of used non-heap memory in bytes. | Only available in Aerospike JMS Inbound 2.0+ and Aerospike ESP Outbound 2.0+. | |
| {connector_name}_jvm_memory_total_max | The maximum amount of heap and non-heap memory in bytes that can be used by the Java Virtual Machine | Only available in Aerospike JMS Inbound 2.0+ and Aerospike ESP Outbound 2.0+. | |
| {connector_name}_jvm_memory_total_used | The amount of used heap and non-heap memory in bytes. | Only available in Aerospike JMS Inbound 2.0+ and Aerospike ESP Outbound 2.0+. | |
| {connector_name}_jvm_os_processCpuLoad | The "recent cpu usage" for the Java Virtual Machine process. | Only available in Aerospike JMS Inbound 2.0+ and Aerospike ESP Outbound 2.0+. | |
| {connector_name}_jvm_os_systemCpuLoad | The "recent cpu usage" for the whole system. | Only available in Aerospike JMS Inbound 2.0+ and Aerospike ESP Outbound 2.0+. | |
| {connector_name}_jvm_threads_total_count | The sum of runnable, terminated, waiting and timed_waiting threads. | Only available in Aerospike JMS Inbound 2.0+ and Aerospike ESP Outbound 2.0+. |
where
- the
gc-nameis the name of the GC used by the JVM. For e.g. G1.
Histograms
Histograms calculate the distribution of a value. It provides the total count of the metric, maximum value, minimum value, mean value, and values at various qunatiles (99%, 95%, etc).
| Name | Description |
|---|---|
| {connector_name}_record_payload_size | Size of records received by the connector in Bytes. |
Timers
Timers time the processing of tasks. A timer metric aggregates timing durations and provides duration statistics, plus throughput statistics. It provides the total count of the metric, maximum time, minimum time, mean time, times at various quantiles (99%, 95%, etc), and mean throughput value and one-minute, five-minute, and fifteen-minute moving average throughput values.
| Name | Description |
|---|---|
| {connector_name}_record_ack_queue | Time spent by a processed XDR record in the ack-queue waiting to be acked to Aerospike XDR source. |
| {connector_name}_record_dispatch | Time spent dispatching an XDR record to the external system being used, such as JMS, Kafka, Pulsar, etc. |
| {connector_name}_record_parsing | Time spent parsing an XDR record. |
| {connector_name}_requests_total | Total time a XDR record has spent in the connector. |
Grafana Integration
Grafana dashboards can be integrated with Prometheus.
Grafana dashboards are packaged as JSON in the outbound connectors and can be imported.
| Outbound Connector | File Path of the Grafana JSON |
|---|---|
| Aerospike JMS Outbound | /opt/aerospike-jms-outbound/grafana/aerospike-jms-outbound-instances.json, /opt/aerospike-jms-outbound/grafana/aerospike-jms-outbound-summary.json |
| Aerospike Kafka Outbound | /opt/aerospike-kafka-outbound/grafana/aerospike-kafka-outbound-instances.json, /opt/aerospike-kafka-outbound/grafana/aerospike-kafka-outbound-summary.json |
| Aerospike Pulsar Outbound | /opt/aerospike-pulsar-outbound/grafana/aerospike-pulsar-outbound-instances.json, /opt/aerospike-pulsar-outbound/grafana/aerospike-pulsar-outbound-summary.json |
| Aerospike XDR Proxy | /opt/aerospike-xdr-proxy/grafana/aerospike-xdr-proxy-instances.json, /opt/aerospike-xdr-proxy/grafana/aerospike-xdr-proxy-summary.json |
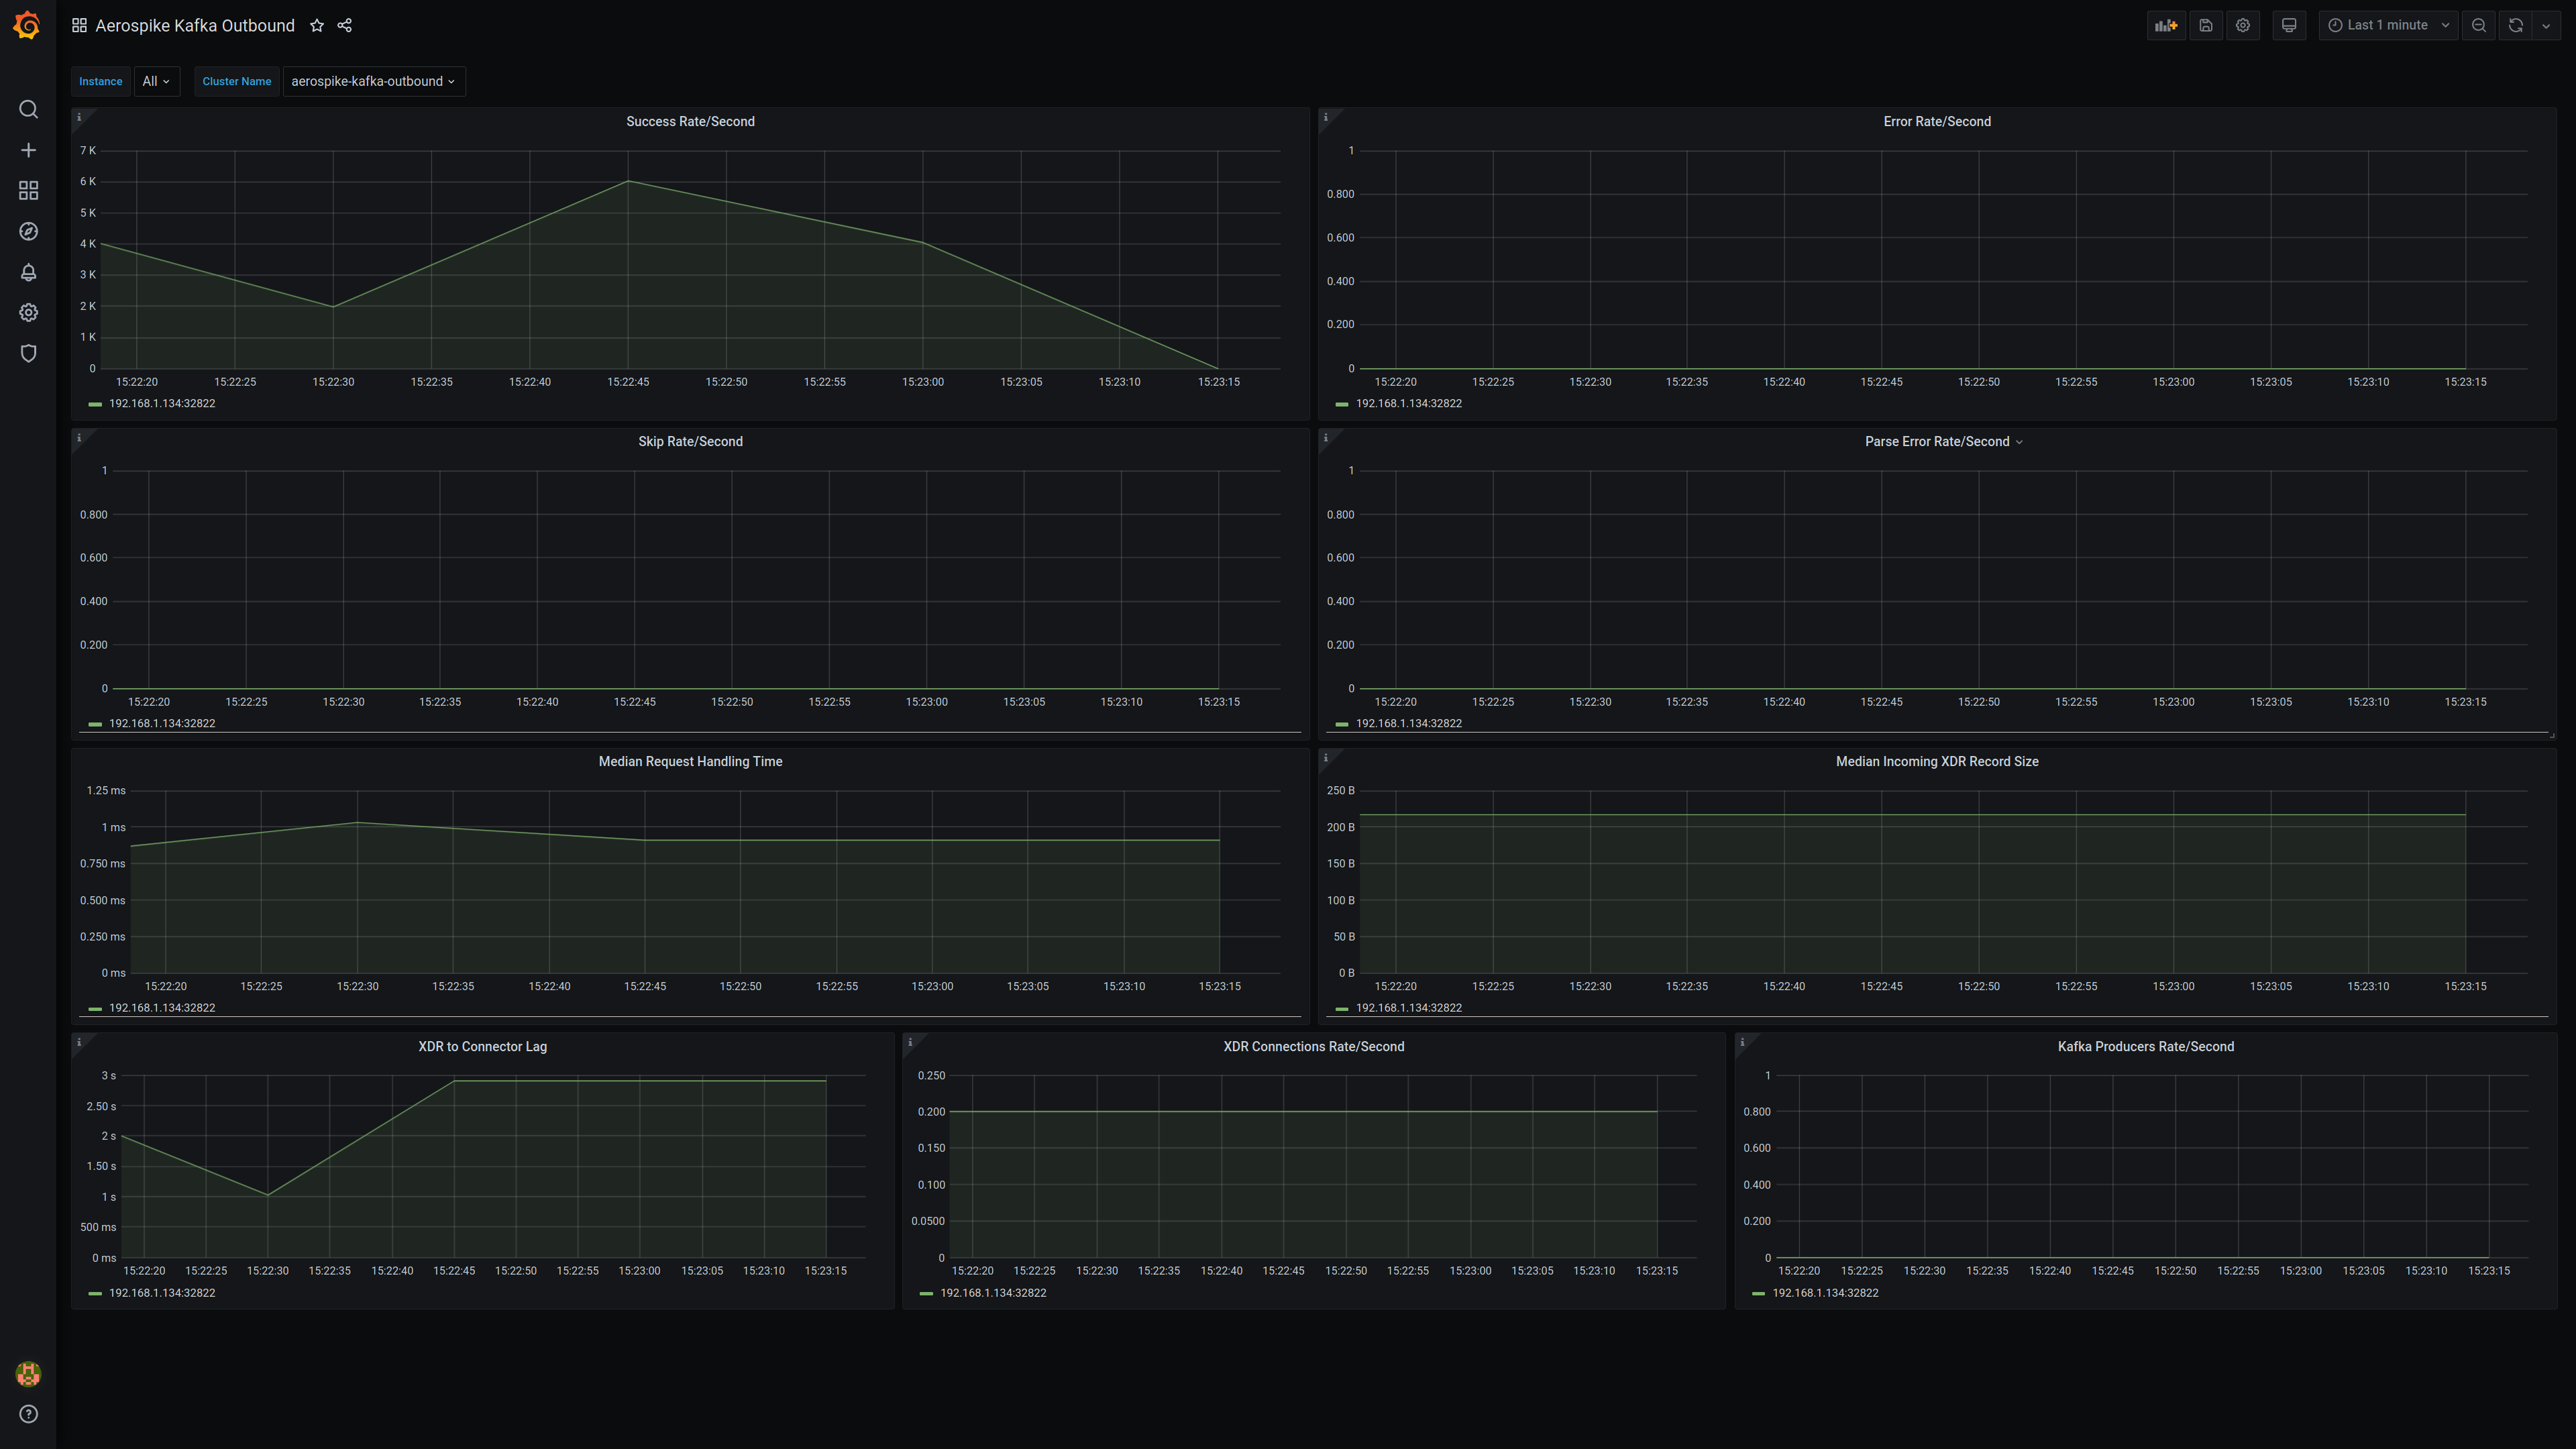
A screenshot of the Grafana dashboard querying Prometheus for Aerospike Outbound metrics data.